
The statistics on failed projects is alarming. IBM says that 60% of projects fail to meet their goals and objectives, PM Solutions says that 37% of projects will fail completely and KPMG says that 70% of organizations surveyed have experienced one or more failed projects in the past 12 months.
It's 2015 and the statistics on failed projects is still very high. With all of the advancements in technology, training, education and certifications why haven't we decreased the percentage of projects that are failing? What are we missing?
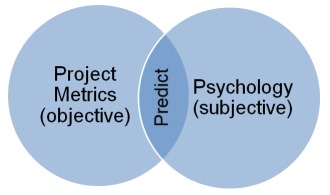
Too often when we sense that a project is not going well we focus on analyzing objective data points to measure the health of a project. This may include but is not limited to reviewing schedule and cost overruns, defect counts, milestone misses, velocity reports or other project management metrics but that's where the analysis typically ends.
We believe that the solution to fixing troubled projects includes analysis of both objective and subjective data points. Subjective data points include measuring team dynamics and assessing the role of each person on the team to determine if you have the right heads in the right hats.
The goal of Project Resilience is to quantify the health of your project against known project failure statistics to determine if measures can be taken to avoid project failure.
Our solution for fixing troubled projects begins by assessing the overall project health via a 65 question project resilience survey which will quantify problem areas and compare the results against known project failures.
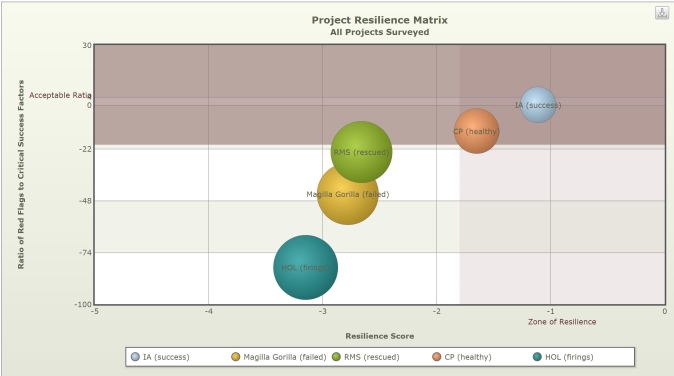
The example below is the RelMap® resiliency matrix that aggregates both the resiliency score and the ratio of red flags to critical success factors into 4 quadrants. The lower quadrant with a white background is the section where the probability of fixing the project is extremely low and project stoppage should be considered. The upper right quadrant represents healthy projects with a high resiliency score and a low ratio of red flags to critical success factors. Both the lower right and upper left sections represent projects that need immediate fixes to make them successful. The full version of the resiliency matrix includes drill-in capabilities to identify the areas needing immediate attention.
In the example below, project Magilla Gorilla ended in complete shut-down while project IA is very healthy and completed with success.
In addition to collecting objective data on the project, we then focus on subjective data points like measuring team dynamics.
The first step to evaluate team dynamics is to perform a ROPE assessment which is used to determine if you have the right heads in the right hats.
ROPE measures:
The second step to collecting subjective data on the project is to further measure the team dynamics via our eMail ediscovery application which can map the team and identify areas where the project team members are concerned.

The image above represents discussion topics where positive conversations are represented in shades of blue and negative conversations are represented in shades of red. There are a number of topics here that require employee follow up.